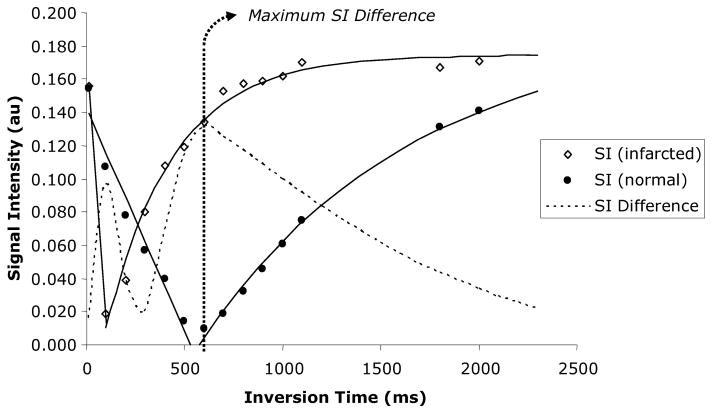
Figure 2.

Representative signal intensities vs. inversion times for normal and infarcted myocardium measured in one rat after application of the inversion pulse. Both the normal and infarcted myocardium reach a point where signal intensities are effectively nulled, followed by a steady recovery of signal with increasing inversion time. The dotted line represents the difference in signal intensity between normal and infarcted myocardium, reaching a maximum when the normal myocardium is ‘nulled’ at an inversion time of approximately 550 ms.
