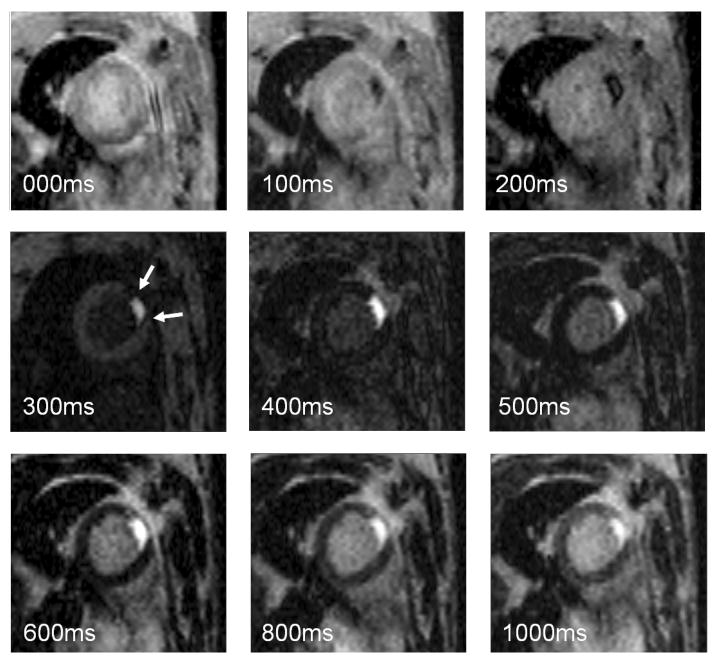
Figure 3.

The panel contains images of varying signal intensity corresponding to increasing inversion times as depicted in Figure 2. At very short inversion times the signal intensity of the infarcted area (arrows) goes through the zero crossing, followed by a gradual recovery. The greatest signal difference is seen at an inversion time of 500–600 ms, where the signal of normal myocardium is fully suppressed, while the signal of the infarcted area has already recovered. Further increasing the inversion time allows for progressive recovery of the magnetization, decreasing the effect of the inversion pulse on image contrast.
