
Figure 4.
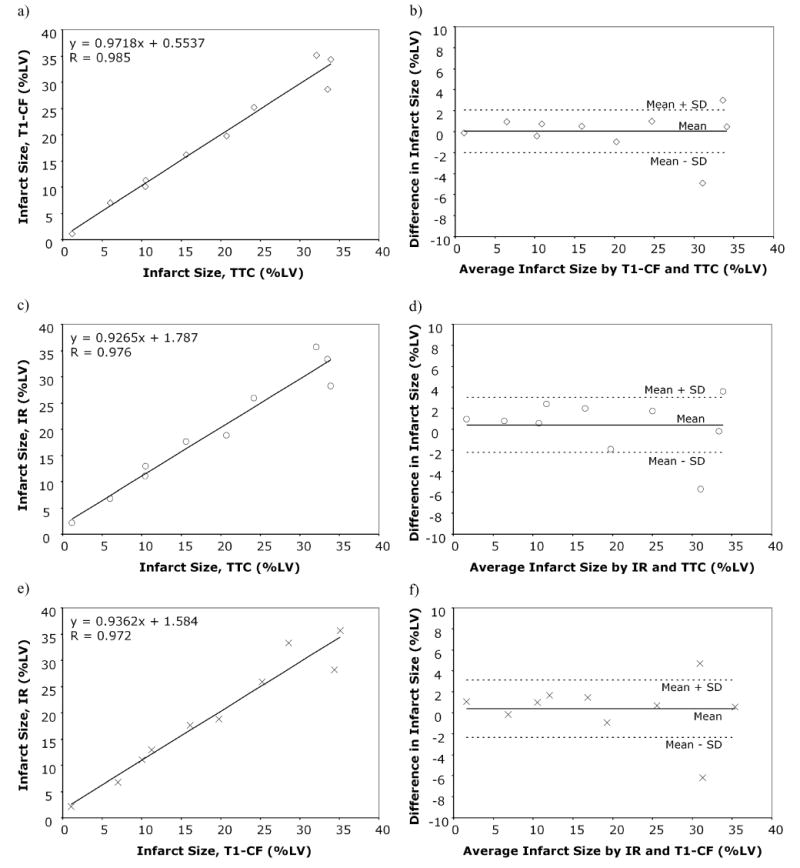
Linear regression plots (left column, a, c, e) and Bland-Altman plots (right column, b, d, f) comparing infarction size as assessed by 60° T1-CF sequence and TTC (a–b); the IR-sequence and TTC (c–d); and the 60° T1-CF and the IR-sequence (e–f). Both 60° T1-CF and IR-sequence show excellent correlation and very close agreement with TTC.