
Fig. 3.
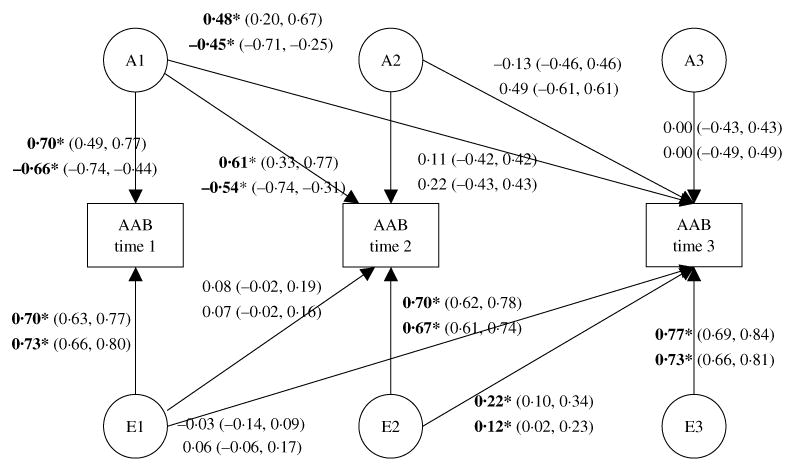
Standardized path diagram of the sex-differences Cholesky decomposition model of adult antisocial behavior (AAB) symptoms. Standardized path estimates of the genetic and environmental contributions to AAB symptoms over time are illustrated. Estimates for men are presented above, while those for women are presented below. Each are followed by their 95% confidence intervals. The standardized shared environmental paths are estimated in the model (men/women: c11=−0.14/−0.20, c21=−0.35/−0.45, c31=−0.31/−0.10, c22=0.04/0.00, c32=−0.13/0.00, c33=0.00/0.00) but are not represented in the figure, for ease of presentation (none of the paths was statistically significant). Paths that are significant at p<0.05 are bolded and indicated by an asterisk. Paths are squared to estimate the proportion of variance accounted for.