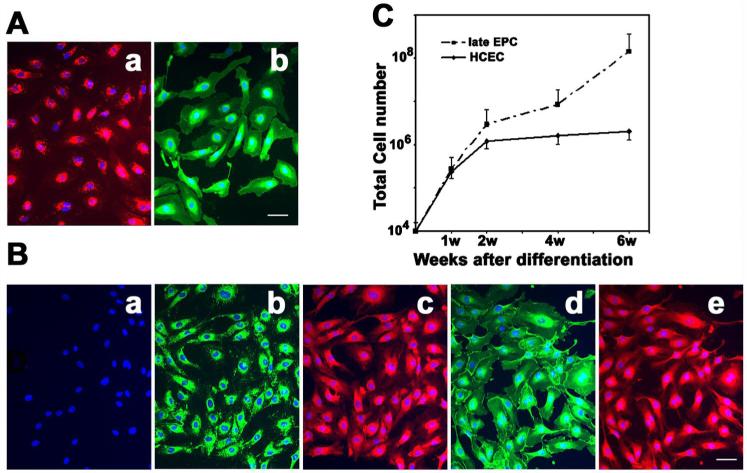
Figure 2. Extended EPC characterization.
A. Photomicrographs show a) DiI-ac-LDL up-taking, and b) FITC-UEA-1 binding assays. Bar=50 μm. B. Photomicrographs show immunostaining of VWF (b), CD34 (c), VE-Cadherin (d), KDR (e), and negative control (a). This result indicated that EPCs had phenotype of endothelial cells. Bar=50 μm. C. Line graph shows the growth curve of EPC compared to mature HCEC following 6-week culture. Each experiment was performed three times. Data are expressed as mean±SD; n=3, *=p<0.05 EPCs vs. HCECs.

