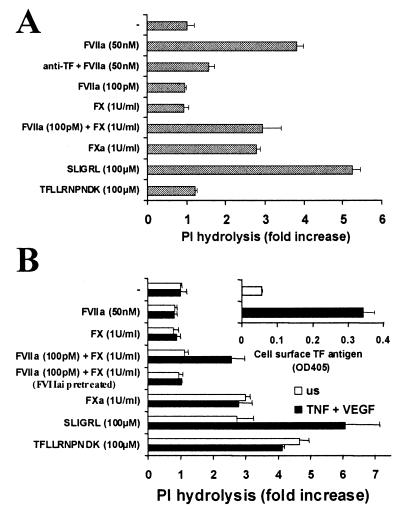
Figure 4.
Protease responses in keratinocytes and vascular endothelial cells. Data shown are fold increase in 3H-inositol phosphate accumulation (mean ± SD, n = 3) and are representative of at least three separate experiments. (A) PI hydrolysis in response to proteases and peptide agonists in keratinocyte line HaCaT, which expresses TF and PAR2 constitutively. Where indicated, anti-TF mAb was added 1 h before agonists. (B) PI hydrolysis in response to proteases and peptide agonists in naïve HUVEC or HUVEC pretreated for 6 h with tumor necrosis factor α (10 ng/ml) and vascular endothelial growth factor (1 nM). Cytokines induce TF expression and increase PAR2 expression in these cells. Cell surface TF expression as determined by surface ELISA with a TF mAb is shown in the inset. Where indicated, active site-inhibited FVIIa was added 1 h before agonists.

