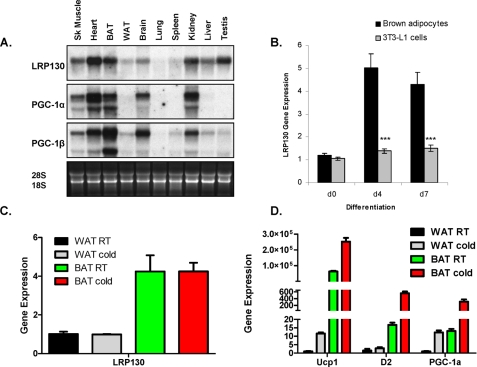
FIGURE 1.
Spatiotemporal distribution of LRP130. A, tissue Northern of LRP130, PGC-1α, and PGC-1β. B, gene expression of LRP130 in differentiating brown fat cells versus 3T3 L1 cells. Differentiation mixture was added on day 0 (n = 3). C, gene expression of LRP130; D, select brown fat genes in white and brown fat depots derived from animals housed at room temperature or exposed to cold at 4 °C for 4 h (n = 5). Statistics: Panel D, no significant change in room temperature versus cold in WAT or BAT for LRP130. Panel C, p < 0.05; D2 changes in WAT not significant. Error bars represent mean (±S.E.). *, p < 0.05; **, p < 0.01; ***, p < 0.001.

