FIGURE 1.
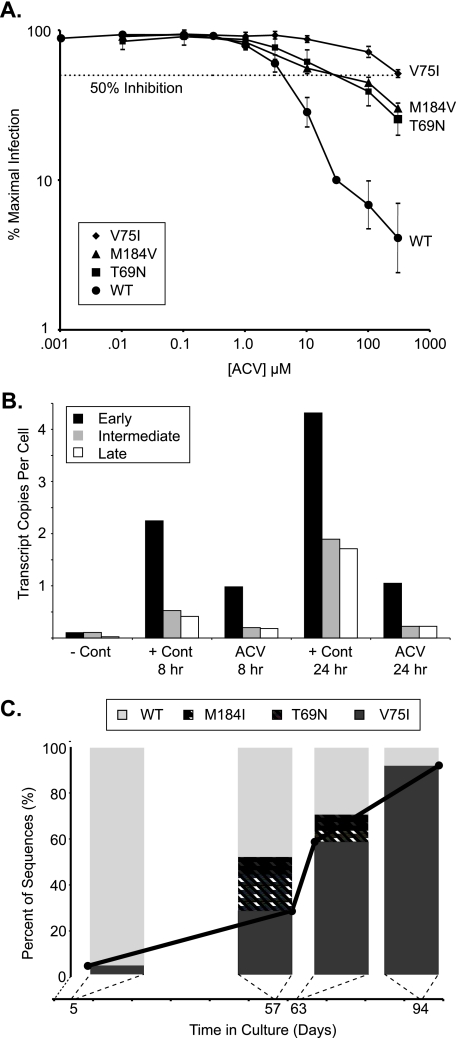
Effects of acyclovir on HIV replication and identification of resistant variants. A, inhibition of HIV infectivity by acyclovir. HIV pseudoviruses derived from the wild-type (WT) clone, NL4-3, and the isogenic clones varying only at positions T69N, V75I, or M184V were used to infect primary CD4+ cells in the presence of varying amounts of acyclovir. GFP-expressing cells were analyzed 72 h after infection. The results are expressed as a percentage of maximal infection, which is determined from (the number of GFP-expressing cells in the presence of acyclovir divided by the GFP-expressing cells in the absence of a drug effect) × 100. The horizontal dotted line represents 50% inhibition. The IC50 values were ∼5 μm for wild-type virus, ∼50 μm for the T69N or M184V point mutants, and >300 μm for the V75I point mutant. When shown, error bars represent the standard deviation from three or more replicates from two or more normal blood donors. B, acyclovir prevents the appearance of reverse transcription products. Primary CD4+ T cells were infected with wild-type NL4-3 pseudovirus in the absence or presence of acyclovir. The amounts of early, intermediate, and late reverse transcripts were quantified by real-time PCR from DNA isolated at defined times and a standard curve generated from known concentrations of pNL4-3-ΔE-eGFP with appropriate primer pairs. The negative control (–Cont) infection was performed at 4 °C, and signal represents residual plasmid from the viral production step. Shown are representative data from one of three experiments with similar results. C, acyclovir selects for mutations in HIV RT. Replication-competent HIV was cultured in the presence of increasing concentrations of acyclovir. The graph presents quantification of proviral variants generated under the selective pressure of acyclovir. The percentage of variants was determined from a minimum of 25 independent sequences at the indicated days in culture. The solid black line denotes the percentage of V75I variant appearing as a function of time.

