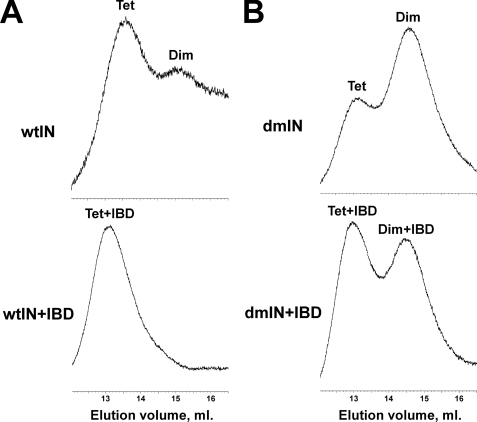
FIGURE 4.
Size exclusion chromatography of free IN and IN-IBD complexes. 2.5 μm IN and 5 μm IBD were used in these experiments. A, chromatograms of wild-type IN protein in its free form (top) and complexed with IBD (bottom). B, elution profiles of the soluble double mutant (F185K/C280S) IN protein in its free form (top) and complexed with IBD (bottom). Peaks corresponding to tetramer (Tet) IN, dimer (Dim) IN, as well as IBD-bound IN tetramer (Tet+IBD) and dimer (Dim+IBD), are indicated.

