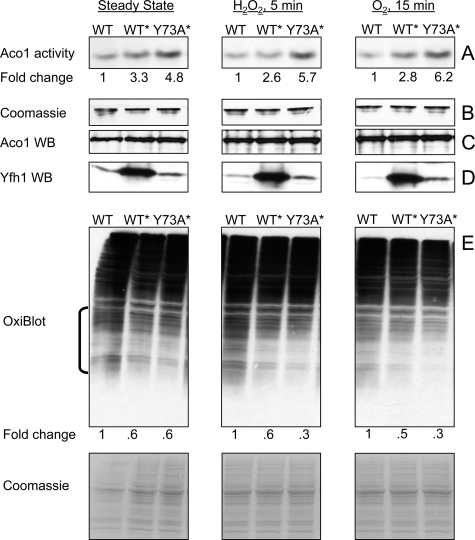
FIGURE 2.
Constitutive presence of trimer enhances aconitase activity and limits protein oxidation. Yeast cultures were grown and mitochondria isolated as in Fig. 1 (C–F). A, in-gel aconitase activity was measured in untreated mitochondria (Steady State) or upon exposure of mitochondria to 100 μm H2O2 or atmospheric oxygen. A fixed amount of total protein (150 μg) was analyzed in each case. Fold change shows the average increase in aconitase activity in WT* and Y73A* relative to WT as determined by ImageQuant 5.0 densitometric analysis of three independent experiments, one shown. The relative densitometric intensity of the aconitase band for WT, WT*, and Y73A* was (means ± standard deviation): Steady State, 11.0 ± 7.0, 36.0 ± 15.7 (p = 0.032), 53.0 ± 13.6 (p = 0.004); H2O2 5 min, 10.8 ± 8.5, 28.0 ± 17.7 (p = 0.101), 61.2 ± 17.4 (p = 0.005); O2 15 min, 10.0 ± 5.0, 28.0 ± 6.3 (p = 0.009), 62.0 ± 11.0 (p = 0.0009). In all cases, the p value was determined versus WT by the t test for equal variances. B, after aconitase activity was measured, the same gel was stained with Coomassie Blue to verify equal protein loading. C and D, aliquots of the mitochondrial preparations analyzed above (20 and 100 μg of total protein for Aco1 and Yfh1 detection, respectively) were analyzed by SDS-PAGE and Western blotting (WB) with specific antisera. E, aliquots of the same mitochondrial preparations (100 μg of total protein) were analyzed with OxiBlot kit to detect carbonylated proteins. ImageQuant 5.0 densitometric analysis was performed on the region denoted by the bracket, after which the membrane was stained with Coomassie Blue to verify equal protein loading (only a portion of the stained membrane is shown). Fold change represents the average decrease in protein carbonylation in WT* and Y73A* relative to WT as determined from three independent experiments, one shown. The relative densitometric intensity of the membrane region analyzed for WT, WT*, and Y73A* was (mean ± standard deviation): Steady State, 45.2 ± 2.1, 27.8 ± 1.6 (p = 0.0002), 27.1 ± 3.4 (p = 0.0007); H2O2 5 min: 51.2 ± 8.0, 31.7 ± 7.7 (p = 0.020), 17.0 ± 2.5 (p = 0.001); O2 15 min, 54.7 ± 6.2, 27.3 ± 5.6 (p = 0.002), 18.1 ± 6.0 (p = 0.0009). The p value was determined as above.

