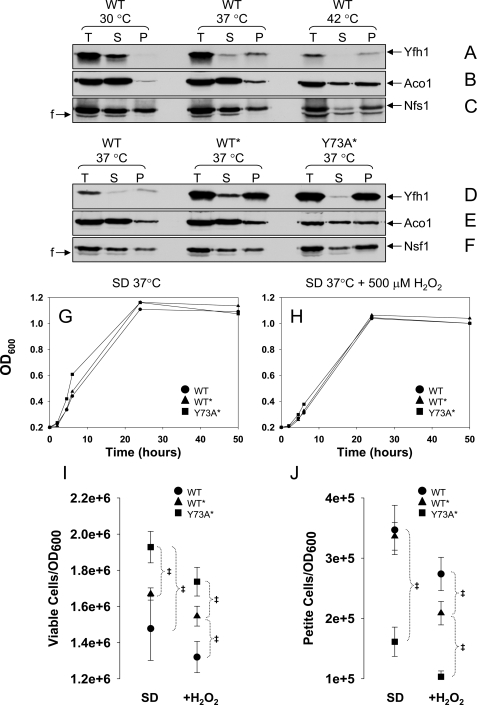
FIGURE 4.
Yfh1 solubility decreases in response to heat stress. A–F, yeast cultures were started from freshly streaked glycerol stocks, preconditioned in SD at 30 °C for ∼12 h, diluted into fresh SD, and grown for ∼24 h at different temperatures, after which the mitochondria were isolated. Total mitochondrial lysates (T; 4.5 mg/ml total protein) were prepared by sonication and separated into supernatant (S) and pellet (P). Equal amounts (by volume) of the T, S, and P fractions were analyzed by SDS/PAGE and Western blotting. In D only, to enable simultaneous detection of Yfh1 in the WT, WT*, and Y73A* strains despite their different levels of Yfh1 expression, the amounts of T, S, and P fractions analyzed for WT* and Y73A* were 5- and 2.5-fold lower, respectively, than those analyzed for WT. The membrane analyzed in B–D was probed sequentially with antibodies against Aco1 and Nfs1, and the membrane analyzed in F and G was probed with antibodies against Aco1 and Nfs1. F, fragment of Nfs1 (65). G and H, yeast cultures were started from freshly streaked glycerol stocks, synchronized to late logarithmic phase in SD at 30 °C for ∼12 h, diluted into fresh SD in the absence or presence of 500μm H2O2, and shifted to 37 °C. The data points are the averages from two independent growth curves. I and J, at different times, aliquots of the cultures were diluted to A600 = 0.0002, equal volumes (150μl) were plated on YPD or YPG plates, and the colonies were counted after 5 days at 30 °C. I and J show the number of viable and nonrespiring cells, respectively, expressed per A600 = 1(1 A600 is ∼1–2 × 10⁷ cells/ml). The data show the means ± standard deviation of four (WT and Y73A*) or two (WT* and T118A/V120A*) independent experiments, with two plates per experiment scored for each strain analyzed. ‡, p ≤ 0.02 as determined by the t test for equal variances.

