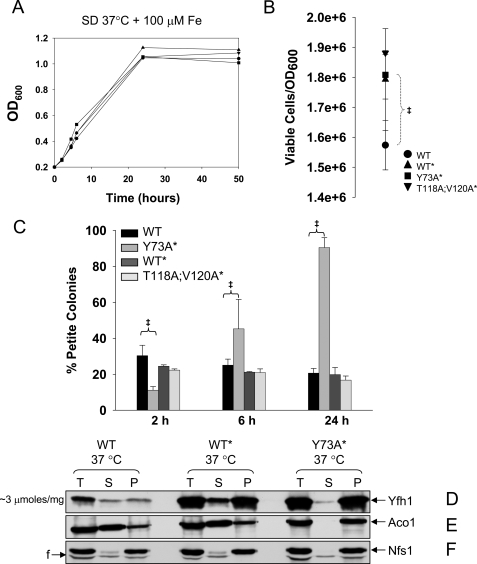
FIGURE 5.
Deregulated assembly of Yfh1 causes Aco1 sequestration and loss of mitochondrial DNA integrity. A, yeast cultures were performed as in Fig. 4G except that 100 μm FeCl3 was added during growth at 37 °C. The data points are the averages of two independent growth curves. B and C, equal numbers of cells from the cultures described above, after 24 h (B) or 2, 6, and 24 h (C) of growth, were plated and scored for viability (B) or respiratory capacity (C) as in Fig. 4 (I and J). The data show the means ± standard deviation of four (WT and Y73A*) or two (WT* and T118A/V120A*) independent experiments, with two plates per experiment scored for each strain analyzed. ‡, p ≤ 0.02. D–F, cultures were performed as above, and mitochondria were isolated. T, S, and P fractions were prepared and analyzed as in Fig. 4. In D only, the amounts of T, S, and P fractions analyzed for WT* and Y73A* were 5- and 2.5-fold lower, respectively, than those analyzed for WT. The membrane analyzed in B and C was probed sequentially with antibodies against Aco1 and Nfs1.

