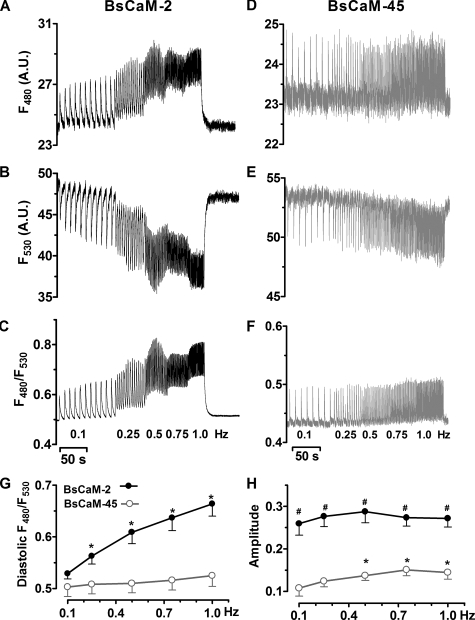
FIGURE 3.
Frequency-dependent Ca2+-CaM signals on a beat-to-beat basis in adult cardiomyocytes expressing either BsCaM-2 or BsCaM-45. A–C, fluorescence signals from CFP emission (F480), YFP emission (F530), and the corresponding ratio (F480/F530) of BsCaM-2. D–F, signals from F480, F530, and F480/F530 of BsCaM-45. G, averaged data of frequency-dependent diastolic levels of F480/F530 of BsCaM-2 (•) and BsCaM-45 (○). n = 6–10. *, p < 0.05 versus 0.1 Hz in the same group. H, averaged data of amplitude of BsCaM-2 (•) and BsCaM-45 (○). Amplitude: (Rsystolic – Rdiastolic)/(Rmax – Rmin). n = 6–10. *, p < 0.05 versus 0.1 Hz in the same group; #, p < 0.05 versus BsCaM-45 at the same frequency.

