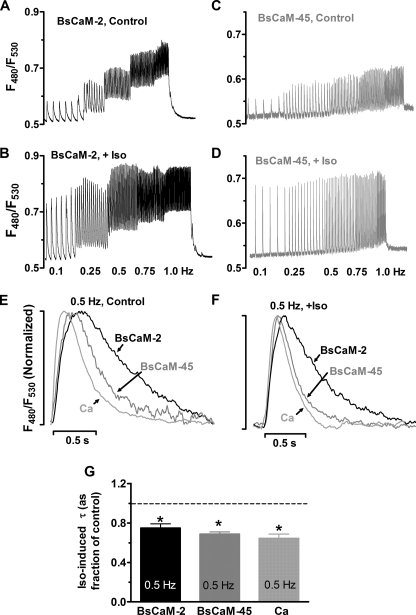
FIGURE 5.
Effects of β-adrenergic stimulation on the beat-to-beat changes of Ca2+-CaM signals. A–D, representative tracings of Ca2+-CaM signals from cells expressing BsCaM-2 or BsCaM-45 without (control, A and C) or with β-adrenergic stimulation using 1 μm Iso (+Iso, B and D). E and F, superimposed normalized tracings of BsCaM-2, BsCaM-45 and Ca2+ transients when cells were paced at 0.5 Hz under control conditions (E) or 1 μm Iso (F). G, averaged data of the Iso-induced signal decay time constant (τ) of BsCaM-2, BsCaM-45, and Ca2+ transient. n = 5–6. *, p < 0.05 versus control.

