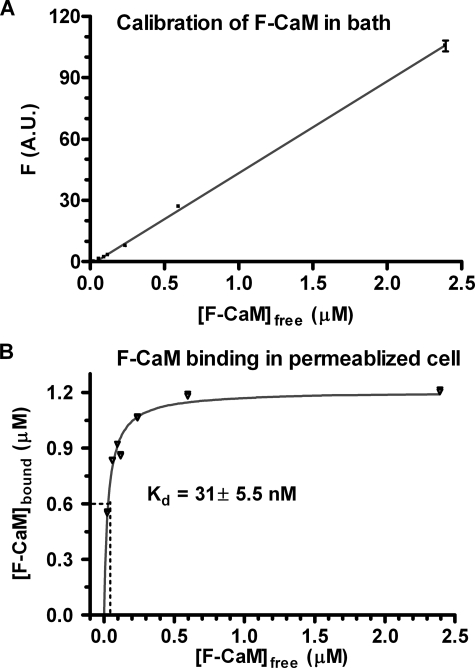
FIGURE 8.
Calibration of F-CaM binding in permeabilized adult cardiomyocytes. A, the fluorescence of different [F-CaM] in internal solution (50 nm free Ca2+) was recorded by confocal microscopy and linear regression was shown (n = 10). B, F-CaM binding affinity in myocytes, which were permeabilized and followed by incubation of [F-CaM] in internal solution for 4–6 h. Fluorescence was taken after reaching the F-CaM binding steady status in the cells (n = 8–10), and the bound F-CaM (μm) was plotted according to A. Standard nonlinear regression analysis was performed to obtain the apparent Kd.

