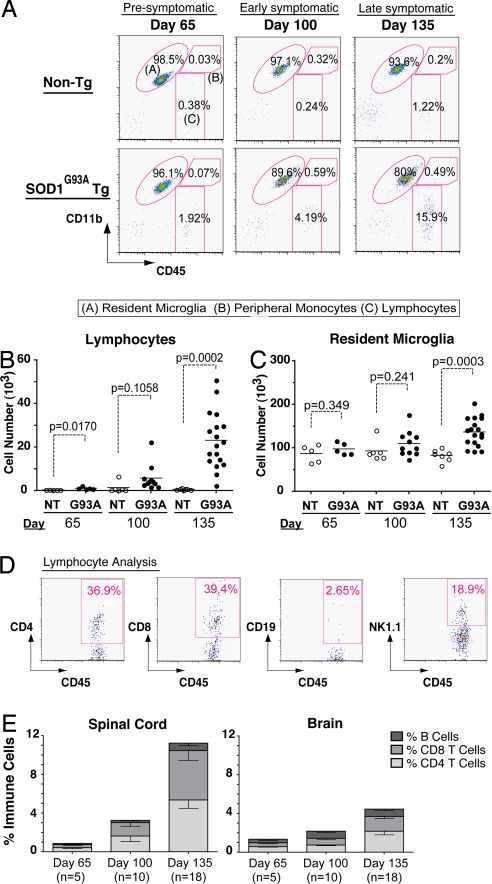
Fig. 1.
Microglia and lymphocyte dynamics in spinal cords of ALS Tg mice. (A) Spinal cords analyzed for resident microglia, infiltrating lymphocytes, monocytes at day 65, day 100, and day 135; representative populations are labeled (A), (B), and (C). (B–C) Cumulative analyses of lymphocytes. Resident microglia show specific increases in SOD1G93A spinal cord over time (p-values by t test). (D) Representative lymphocyte analysis for CD4+, CD8+ T cells, CD19+ B cells, and NK1.1+ natural killer cells. (E) Proportional increases in specific lymphocyte subsets relative to total immune cells in spinal cord, brain of SOD1G93A mice. (Error bars show SEM.)

