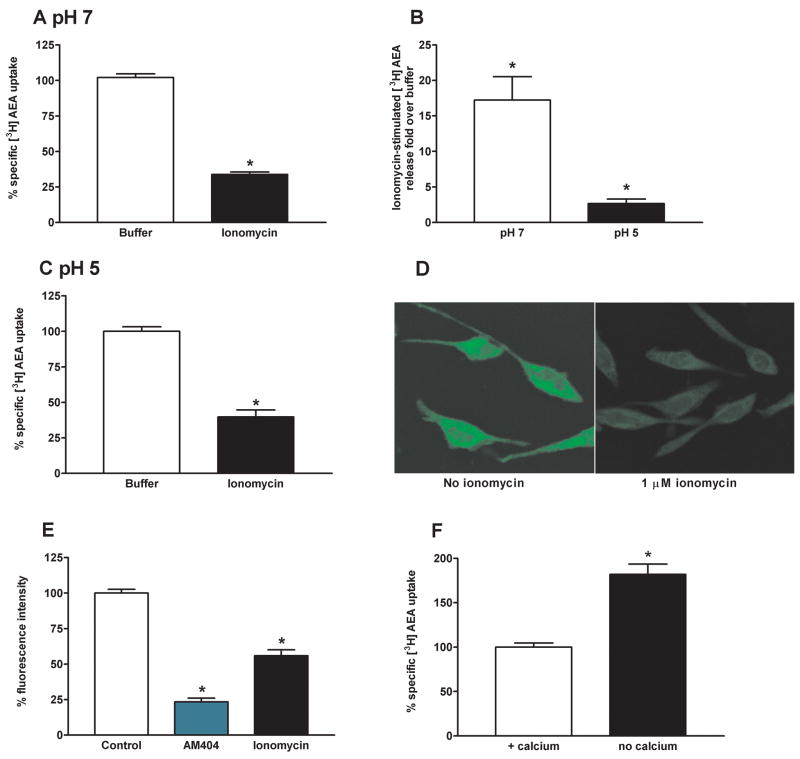
Figure 5. Elevation of intracellular calcium reduces AEA uptake in RBL-2H3 cells.
RBL-2H3 cells were incubated with 1 nM [3H] AEA in the presence or absence of 1 μM ionomycin for 10 min at 37 °C at pH 7.1 (A) or 5.1 (C). The assay was performed in the presence or absence of AM404 (100 μM) in order to define nonspecific uptake. B) Cells were incubated with 1 nM [3H] AEA for 24 hours, and AEA synthesis was evaluated at pH 5.1 or 7.1. D) SKM 4-45-1 uptake in RBL-2H3 cells was investigated in the presence or absence of 1 μM ionomycin and detected with fluorescence microscopy. E) RBL-2H3 cells were incubated with AM404 (100 μM) or ionomycin (10 μM) for 10 min prior to adding SKM 4-45-1 (25 μM) at 37 °C. Fluorescence intensity was measured on the Fusion™ α-FP fluorescence spectrometer. Excitation wavelength was set at 485 nm, emission wavelength was set at 535 nm. The instrument settings were as follows: fluorescence bottom read with well read and well repeats were set at 1, lamps intensity was set at 20, gain at 1, photomultiplier tube voltage at 1100 V. F) RBL-2H3 cells were incubated with 1 nM [3H] AEA in the presence or absence calcium in the buffer for 10 min at 37 °C at pH 7.1. The assay was performed in the presence or absence of AM404 (100 μM) in order to define nonspecific uptake. In panels A-C a two-tailed paired t-test was performed for statistical analysis, * p<0.05. In panel E a one-way ANOVA with Newman-Keul’s post-hoc test was performed for statistical analysis, * p<0.05. In panel F a two-tailed paired t-test was performed for statistical analysis, * p<0.05. Data represent mean ± SEM from three separate experiments performed in duplicate. Mean ± SEM CPM values corresponding to the specific [3H] AEA uptake were: buffer = 5008 ± 764 and ionomycin = 2232 ± 564. CPM values corresponding to the synthesis of [3H] AEA at pH 7 were: buffer = 43 ± 9 and ionomycin = 964 ± 406; and at pH 5 were: buffer = 39 ± 8 and ionomycin = 123 ± 79. The arbitrary fluorescence units corresponding to the total uptake of SKM 4-45-1 were 18850 ± 4178, AM404 = 9890 ± 2001, and ionomycin = 15973 ± 3625.

