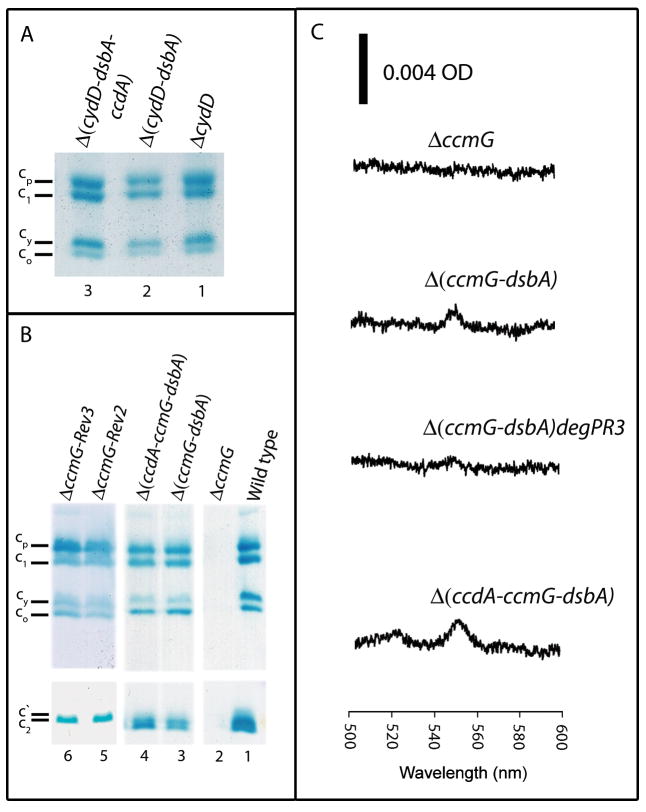
Fig. 3. Cyt c profiles of R. capsulatus thio-redox mutants.
The cyts c production in the putative glutathione transporter mutant ΔcydD (STD1) and its derivatives Δ(cydD-dsbA) (STD3) and Δ(cydD-dsbA-ccdA) (STD5) (A), in the wild type (MT1131) and Ccm thio-reduction mutant ΔccmG (MD11), its Ps+ revertants (ΔccmG-Rev2) (MD11R2) and ΔccmG-Rev3) (MD11R3) and its derivatives Δ(ccmG-dsbA) (ST21) and Δ(ccdA-ccmG-dsbA) (ST34) (B), grown by respiration in minimal medium were determined by SDS-PAGE/TMBZ as described in Fig. 2 and Materials and Methods. Different cyts c are indicated on the left. (C) Cyt c2 levels in the Ccm thio-reduction mutant CcmG and its derivatives: Ascorbate-reduced minus ferricyanide-oxidized optical difference spectra of soluble fractions (protein concentration of 0.5 mg/ml) obtained from R. capsulatus strains ΔccmG, Δ(ccmG-dsbA), Δ(ccmG-dsbA)degPR3 (ST40) and Δ(ccdA-ccmG-dsbA) (Table 2) were determined as in Fig. 2.

