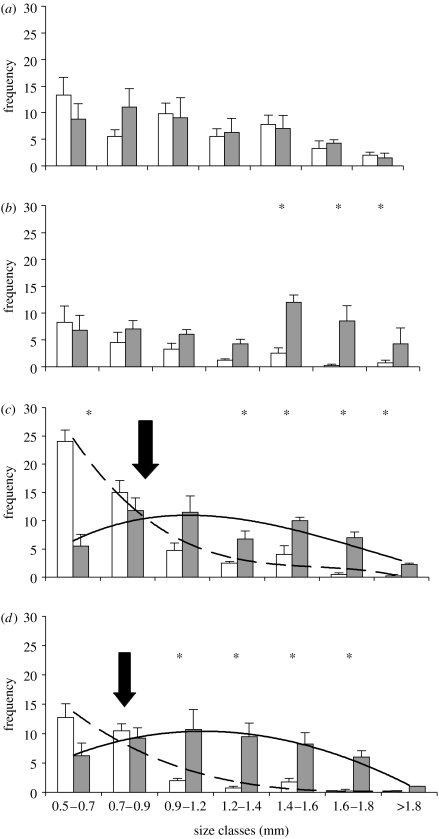
Figure 2.
Predator induced day-time vertical distribution among size classes. Mean (±1 s.e.) frequency (number of D. longispina) in each size class (0.5 to greater than 1.8 mm) at surface (open bars) and bottom (grey bars) waters from June to September. Experimental treatments are: (a) visible light only (V), (b) ultraviolet radiation (UV), (c) visible light and predator cue (VF) and (d) UV plus predator cue (UVF). For clarity, best-fitted curve models are shown for surface (VF; dotted line; y=−0.24x3+3.85x2+21.38x+42.36; r2=0.97) and bottom frequencies (VF; solid line; y=0.08x3−1.63x2+7.70x+0.25; r2=0.70). Similar equations for UVF are: y=−0.06x3+1.34x2−9.38x+21.75; r2=0.92; and y=0.014x3−0.87x2+5.28x+1.93; r2=0.99). Stars show significant (p<0.05; MANOVA; general linear model) differences between frequencies of each size class in surface and bottom waters. Arrows indicate where frequency curves cross, i.e. at which size the majority of Daphnia chose to avoid surface waters.

