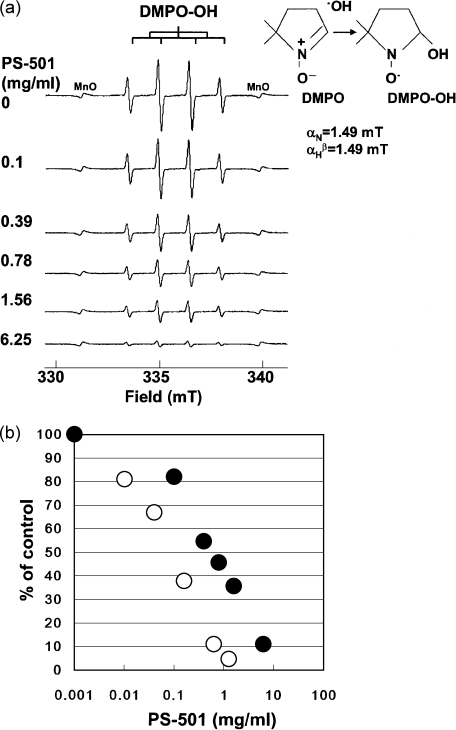
Fig. 1.
(a) Representative ESR spectra of DMPO-OH at the various concentrations of PS-501 (DMPO: 4.5 mM). Hydroxyl radicals were generated by Fenton reaction. (b) A dose-response curve of hydroxyl radical scavenging activity for PS-501 (Fenton reaction). The relative peak height of the second peak of DMPO-OH spin adduct was plotted against the concentration of MG. The intensity of the DMPO-OH spin adducts was normalized by an internal standard, MnO. The symbol of the closed circles and opened circles represent the data points obtained by using 4.5 and 0.45 mM DMPO (each final concentration), respectively.

