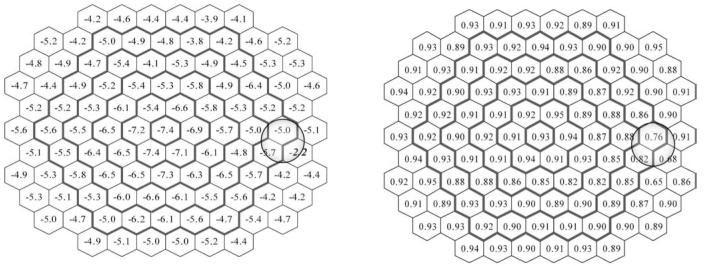
Fig. 5.
Percent change per decade for the N1P1 amplitude (nV/deg2) at each location (left) and correlation between N1P1 amplitude and the scalar product values (right). In the left panel, the italicized bold number indicates the location (hexagon N-67) where linear regression was not statistically significant

