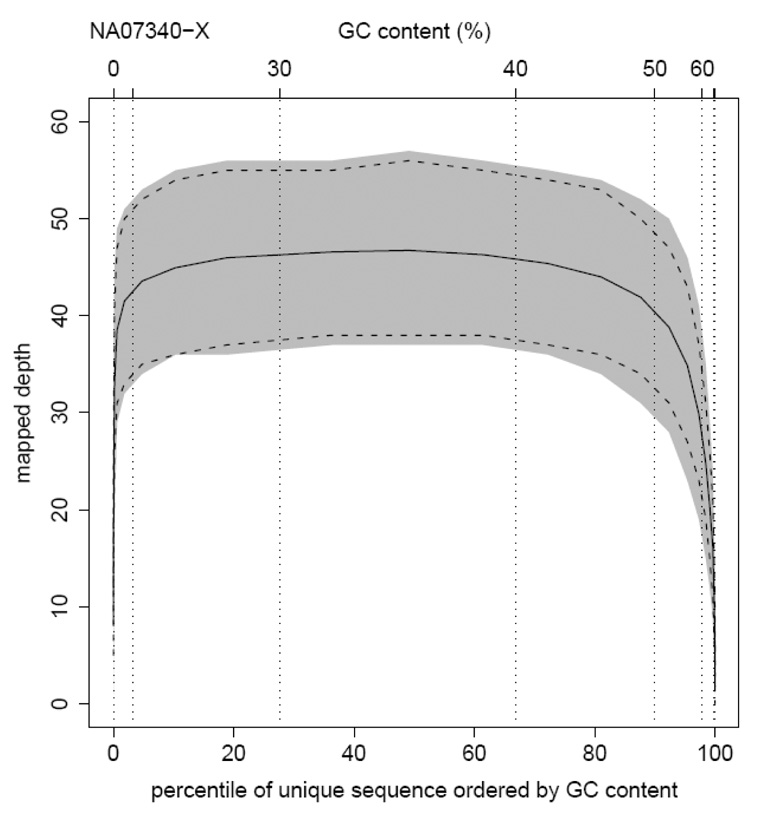
Figure 2. X chromosome data.
a. Distribution of mapped read depth in the X chromosome dataset, sampled at every 50th position along the chromosome and displayed as a histogram (‘all’). An equivalent analysis of mapped read depth for the unique subset of these positions is also shown (‘unique only’). The solid line represents a Poisson distribution with the same mean. b. Distribution of X chromosome uniquely mapped reads as a function of GC content. Note that the x axis is % GC content and is scaled by percentile of unique sequence. The solid line is average mapped depth of unique sequence; the grey region is the central 80% of the data (10th to 90th centiles); the dashed lines are 10th and 90th centiles of a Poisson distribution with the same mean as the data.


