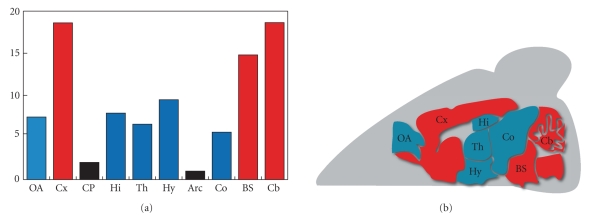
Figure 1.
Expression of PPARβ in the adult mouse brain. Quantitative and spatial expression of PPARβ in the mouse brain: (a) Quantitative RT-PCR data, (b) Brain sagittal section. Moderated expression levels are in red and weak expression in blue. OA: olfactory areas, Cx: cerebral cortex, CP: caudate putamen, Hi: hippocampus, Th: thalamus, Hy: hypothalamus, Arc: arcuate nucleus, Co: colliculus, BS: brain stem, Cb: cerebellum. (MousePat: http://www-mci.u-strasbg.fr/mousepat/-consulted 8-08-2008).

