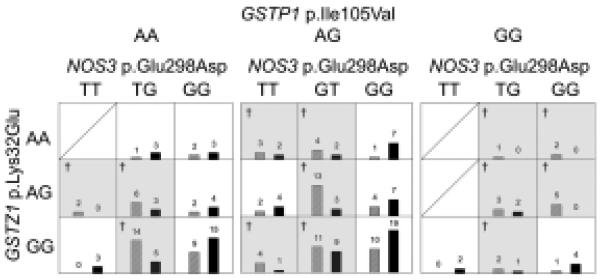
Fig. 1.
A graphical representation of the three-gene MDR model with 64% prediction accuracy. Each cell shows the number of cases (left side of each cell; hatched bars) and controls (right side of each cell; solid bars) carrying that combination of the three genotypes from the GSTZ1 p.Lys32Glu, GSTP1 p.Ile105Val, and NOS3 p.Glu298Asp polymorphisms. Shaded cells (also denoted with the † symbol) are higher-risk, based on the proportion of cases vs. controls carrying that particular genotype combination.

