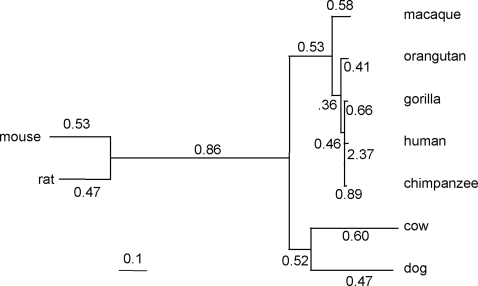
Figure 4. The phylogeny for nine mammalian species.
The branch lengths, in the expected number of nucleotide substitutions per codon, are estimated under the free-ratios model [18] from analysis of the BRCA1 genes, while the estimated ω ratios for branches are shown along the branches.

