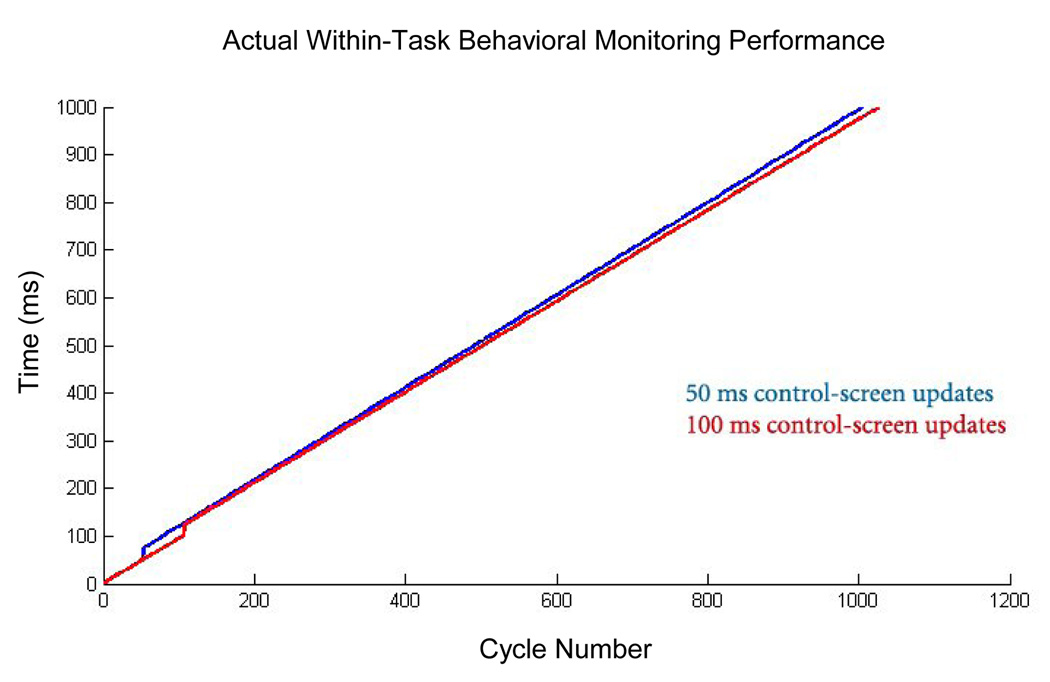
Figure 5. Actual Within-Task Behavioral Monitoring Performance.
Plotted here is cycle number versus time, in milliseconds, on our test system (see Methods for specifications). There is a linear relationship between these variables, demonstrating roughly equal time intervals between samples. The one exception to this linearity occurs at the time of the first call for a control-screen update (the issuing of a “drawnow” command at 50 ms for the blue line and 100 ms for the red line); at that time, a gap of approximately 23 milliseconds was measured, meaning the software was blind to changes in the behavioral signal during this time. Importantly, no further such gaps are seen afterward, despite continued calls for updating the control screen at regular 50 or 100 ms intervals. Note that the actual screen update is not expected to occur at these times because of the slower refresh rate (60 Hz) and potential delays within OpenGL (the graphics library used by Matlab). Unlike the subject’s display, the experimenter’s display is low-priority (all that is required is a subjective sense of smooth motion), so these delays were not considered problematic. In contrast to what is depicted here, within our software, this first update is called in the first cycle, thereby fixing the expected “blind” interval to the very beginning of the behavioral tracking period. Note also that there is a slight difference in slope between the 50 and 100 ms conditions, reflecting fewer cycles executed in the former case. This likely reflects added background cost when there is an increased frequency of control screen updates (here, this cost is only on the order of 2 to 3 percent).

