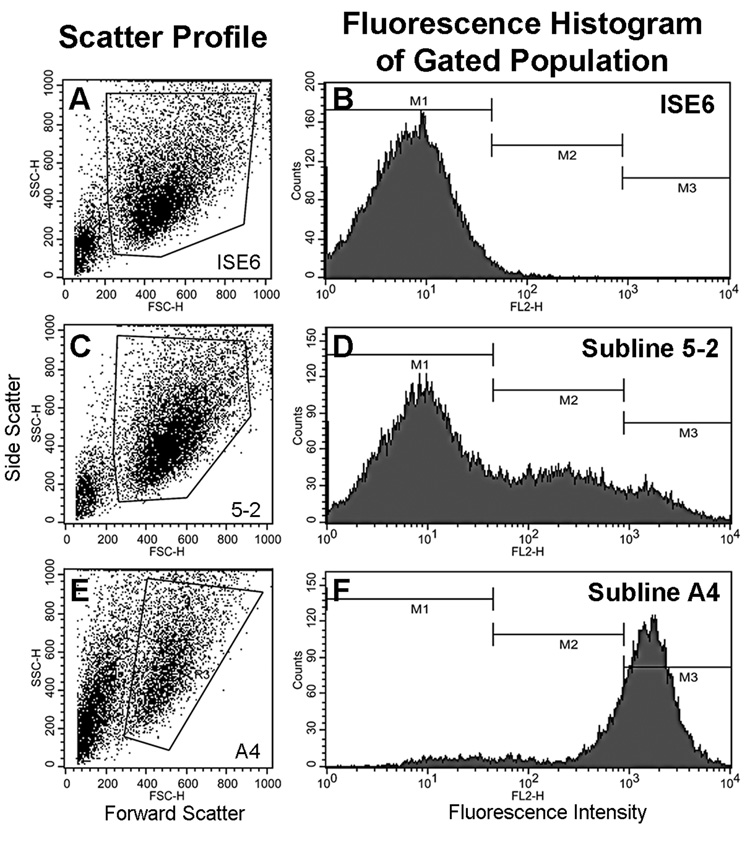
Fig. 3.
Flow cytometry of untransformed ISE6 and sublines 5-2 and A4 containing transformed cells expressing the red fluorescent protein DsRed2. Scatter profiles display the selective gating of events to exclude debris and aggregated cells from the fluorescence histograms. Region M1 includes autofluorescent cells, region M2 contains cells of low and intermediate fluorescence and region M3 includes the highly fluorescent cells.

