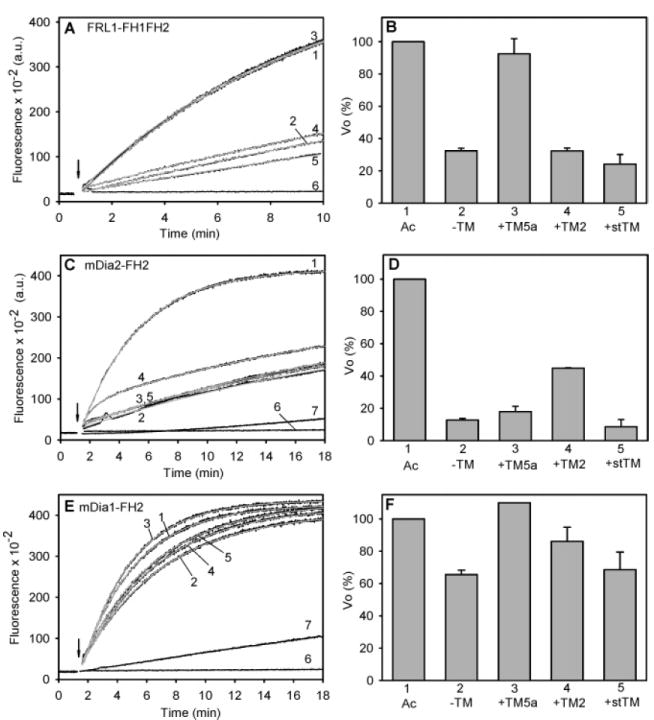
Figure 2.

Effect of tropomyosin on elongation at the barbed end of actin filaments in the presence of formin. (A, C, E) Representative time courses. (B, D, F) Relative initial rates of elongation. (A, B) 25 nM FRL1-FH1FH2, 1 μM F-actin seeds; n = 4. (C, D) 50 nM mDia2-FH2, 2 μM F-actin seeds; no TM, n = 4; TM5a, n = 4; TM2, n = 2; stTM, n = 3. (E, F) 25 nM mDia1-FH2, 2 μM F-actin seeds; noTM, n = 3; TM5a, n = 1; TM2, n = 2; stTM, n = 2. The tropomyosin concentrations and ionic conditions are the same as those in Figure 1. Curves: 1, F-actin alone (no formin or tropomyosin); 2, F-actin with formin, no tropomyosin; 3, formin and TM5a; 4, formin and TM2; 5, formin and stTM; 6, G-actin alone, no F-actin seeds; and 7, G-actin with formin, no F-actin seeds. FRL1-FH1FH2 had no effect with G-actin alone and is not shown. The gray curves are the fits to the data. Ac: F-actin, without tropomyosin or formin (from curve 1).
