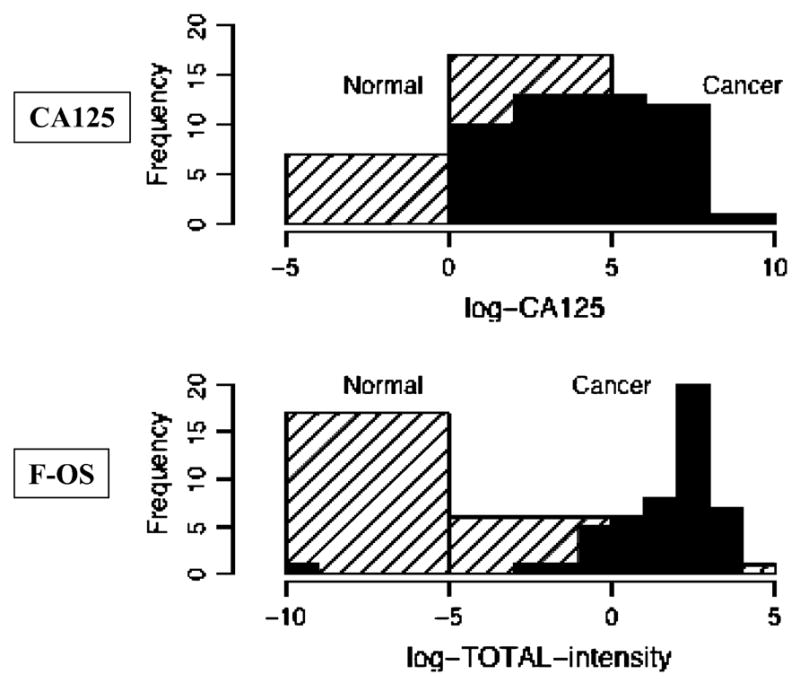
Figure 2.

Histograms comparing the results of healthy control subjects vs ovarian cancer patients using either CA125 serum levels or the glycans assay results. Both the CA125 serum levels and the glycans assay results have undergone logarithmic transformation to allow for comparison. When the two groups are compared using the CA125 results, there is a large overlap of similar values. In contrast, when the two groups are compared using the glycans assay results the values segregate more distinctly.
