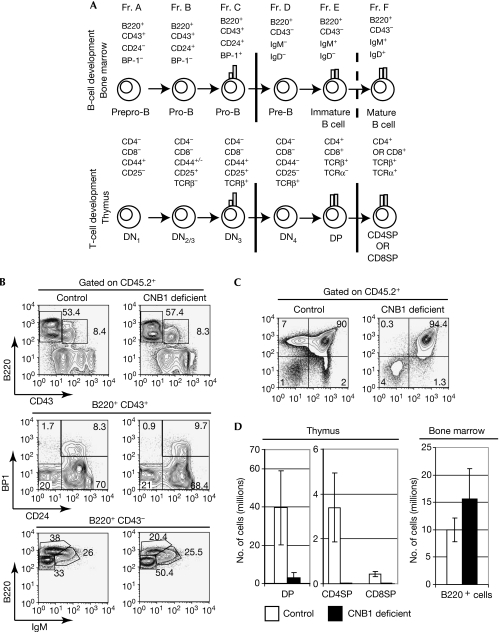
Figure 3.
CNB1-deficient B- and T-cell development in a non-competitive setting. (A) Diagram illustrating stages and surface marker in B- and T-cell development. Bars indicate principal developmental checkpoints. (B) CD45.1+ B6.SJL lethally irradiated mice were injected with CD45.2+ control or CNB1-deficient bone marrow and then analysed 4 months after transplantation by flow cytometry. Figure shows the percentage of developing B-cell subsets in the bone marrow of transplanted recipients. (C) Percentage of developing T-cell subsets in the thymus of transplanted recipients. (D) Absolute numbers of CD45.2+ developing T and B cells in transplanted mice. DN, double negative; DP, double positive.

