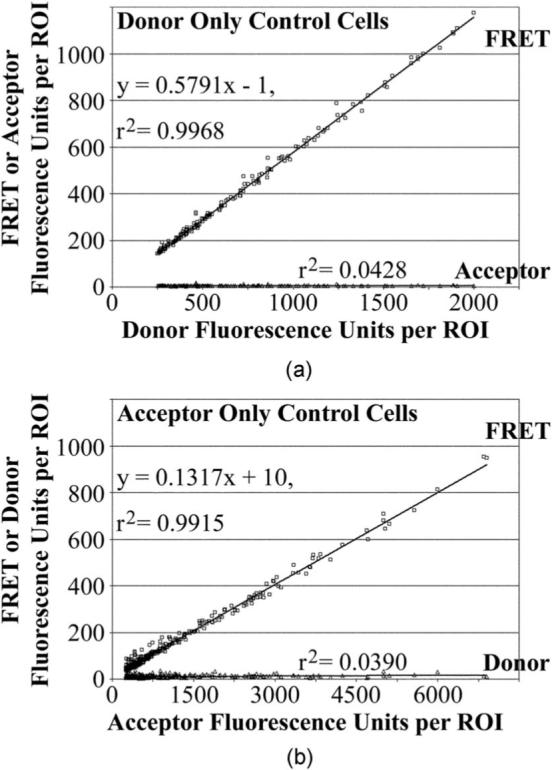
Fig. 2.

Bleed-through control values determined by linear regression. (a) The amounts of background-subtracted fluorescence from the donor-labeled ERα (CFP or mCFP) in the FRET or acceptor channel in relationship to the donor channel. The r2 values indicate whether the data points fall along a straight line. For a linear relationship, the slope of the line represents the bleed-through contributions of the donor to each channel. (b) Similar analysis for the acceptor-labeled ERα (YFP or mYFP). The bleed-through and r2 values for each of the five experiments are shown in Table 2.
