Fig. 3.
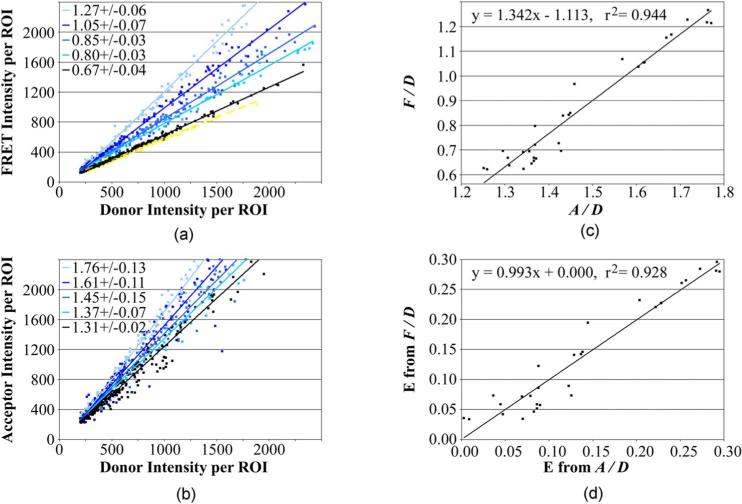
Establishment of calibration constants to convert acceptor-bleedthrough-corrected FRET/donor (F/D) measurements into the proportion of donor transferred to acceptor (E). Background-subtracted and acceptor bleed-through corrected intensity measurements in the acceptor (A), donor (D), and FRET (F) channels were collected from cells expressing a dual-labeled CFP-AR-YFP calibration standard. (a) F/D ratios for 30 different CFP-AR-YFP calibration standards (only five shown here) were collected by plotting F against D for a large number of cells. The F/D ratios for those five standards (mean ± SD from six independent studies) are shown in the inset. (b) A/D ratios from the same cells were collected by plotting A against D. (c) As outlined in Sec. 2.4, Eq. (7), plotting F/D against A/D, yields a curve with a y intercept that is the difference of the constants KfD and KfaD. The slope of that same curve represents KfaD divided by KaD (see Sec. 2.4 for definition of the constants). Establishment of the calibration constants enables E to be extrapolated from the easily and accurately measured F/D ratio [Eq. (3)]. (d) Comparison of E determined from the F/D ratios with E determined from the A/D ratios [Eq. (6)] for the 30 calibration standards. (Color online only.)

