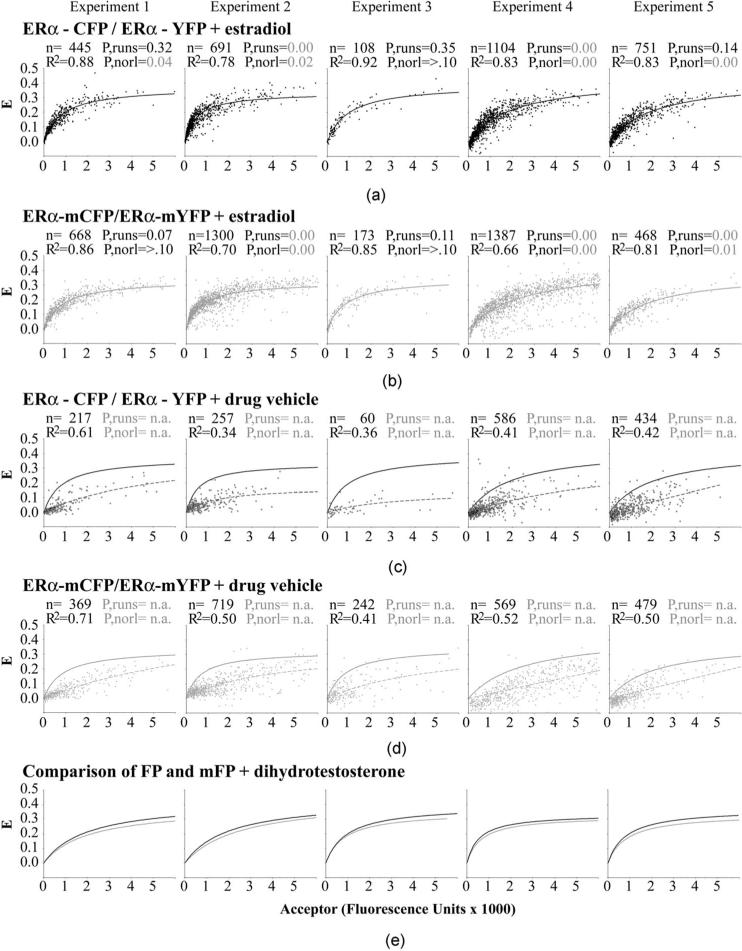
Fig. 5.
FRET measurement of the dimerization kinetics of the estrogen receptor (ERα) labeled (a) and (c) with the dimer competent FPs or (b) and (d) with the monomeric A206K FP mutants. (a) and (b) Plotting the amount of complex formed (represented by E) against the concentration of acceptor present (x axis) shows that the data points fit well to a curve indicative of a one-site, bimolecular interaction, when the cells are grown in the presence of estradiol. The curve fitting values (R2, P-values from runs test, P-values for normal distribution) are shown for each dataset, along with the number of cells analyzed (n). P-values of <0.05 (shown in gray) are considered to represent significant deviation from the expected number of runs or from a normal distribution of the data points around the best-fitting curve. The data from five separate experiments are shown in five different columns of data to assess data reproducibility. (c) and (d) Similar analysis for cells grown without the addition of estradiol; the curves obtained for the binding in the presence of estradiol are shown as solid lines to compare against the no estradiol control cells (dashed lines). (e) Direct comparison of the dimeric CFP/YFP and monomeric mCFP/mYFP binding curves obtained in parallel experiments.

