
Figure 5.
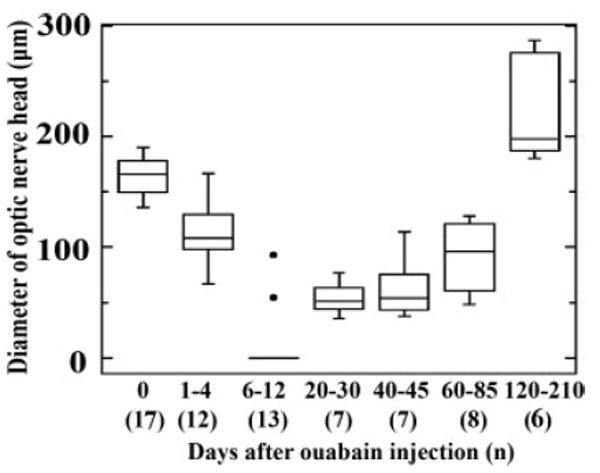
Optic nerve head diameter as a function of time following intraocular injection of 10 μM ouabain. In this boxplot, boxes delineate the upper and lower quartiles, and whiskers indicate the range of values for each time point. The horizontal lines within each box indicate the means. The “0 days” time point includes data collected from contralateral control eyes obtained at several times after ouabain treatment. At 6–12 days, the median is zero, and the significant outliers are represented by filled circles. A measurement of zero indicates no axons were seen to pass from within the eye to the exterior of the eye.