
Figure 6.
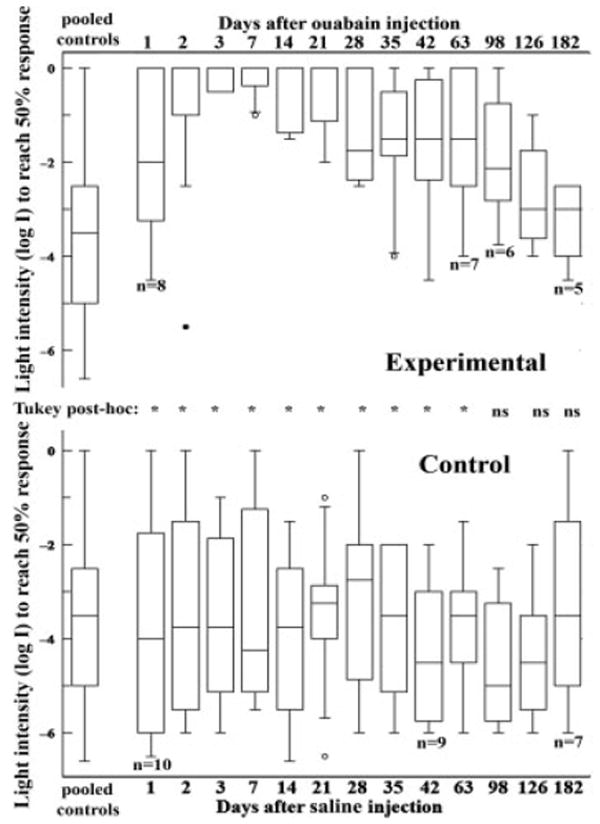
Visual sensitivities of (A) 10 μM ouabain-treated (n = 8 initially) and (B) control (n = 10 initially) zebrafish as assayed by the escape response. In this experiment, the absolute visual threshold of a fish exhibiting an escape response at a given light level (log I = 0 corresponds to ambient light or 4.25 × 10⁻³ μW/cm2) is determined by quantifying the number of escapes to a moving visual stimulus. In both A and B, the leftmost boxplot describes pooled data for all control measurements; remaining boxplots are plotted according to time of assay following injection of the ouabain-treated animals. Boxes delineate the upper and lower quartiles, and whiskers indicate the range of values for each time point (outliers are represented by open circles and significant outliers by filled circles). Statistical analysis (inset between A and B) demonstrated loss and recovery of visual function in the ouabain-treated zebrafish. A Tukey post hoc multiple comparisons test revealed significant differences (*) in visual threshold in ouabain-treated vs. pooled controls at all time points except those at 98 days and beyond. ns, not significant.