
Figure 10.
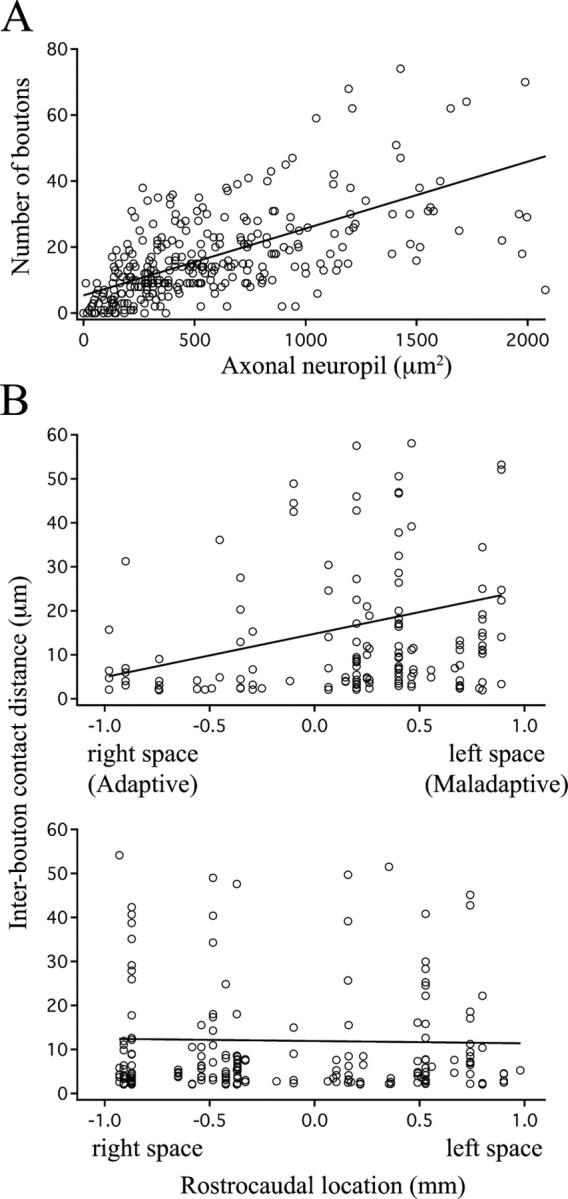
Bouton–dendrite contacts. A, Relationship between number of boutons and density of axonal neuropil for all cases (normal juveniles plus prism-adapted owls). There was strong positive correlation (n = 301; r = 0.605; p < 0.0001). B, Distribution of ICD values for bouton–dendrite contacts across the adaptive, normal, and maladaptive zones. This is a recapitulation of the analysis shown in Figure 6 A, but restricted to contacts formed by a presynaptic bouton. There was a significance correlation for prism-adapted owls (n = 152; r = 0.220; p = 0.0065), with greater clustering in the adaptive zone. The regression for normal juveniles was nearly flat (n = 205; r = −0.018; p = 0.80).