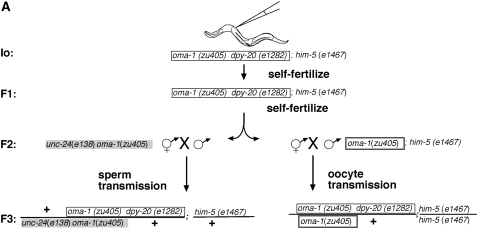
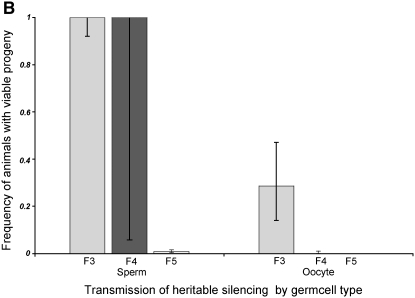
Figure 7.—
Comparison of silencing transmission capacity for oocytes and sperm. (A) Genetic scheme. We first selected one injected animal (I0) to produce F1 and F2 descendants by self-fertilization. We then selected one F2 animal with a large brood size to separately assess sperm and oocyte transmission of silencing. (B) Results of sperm/oocyte comparison. F3 cross-progeny animals were scored individually (7 animals for oocyte transmission and 6 for sperm transmission). F4 descendants were scored in groups of siblings rather than individually since our previous experiments (Figure 2) indicated a consistent F4 bottleneck. In the oocyte experiments, only 2 of 7 F3 animals had progeny: 1 animal had 48 progeny and 1 animal had 1 progeny. None of the F4 animals had F5 progeny. In contrast, in the sperm-transmission experiments, all 6 F3 animals had viable progeny, with brood sizes ranging from 28 to 80. We used groups of F4 animals from sperm transmission and found 26/26 plates with 10 animals to a plate to have viable progeny. To analyze the F5 silencing, we checked the F4 plates for fertile F5 animals. We found 2/26 plates with viable F5 progeny.


