Figure 3.—
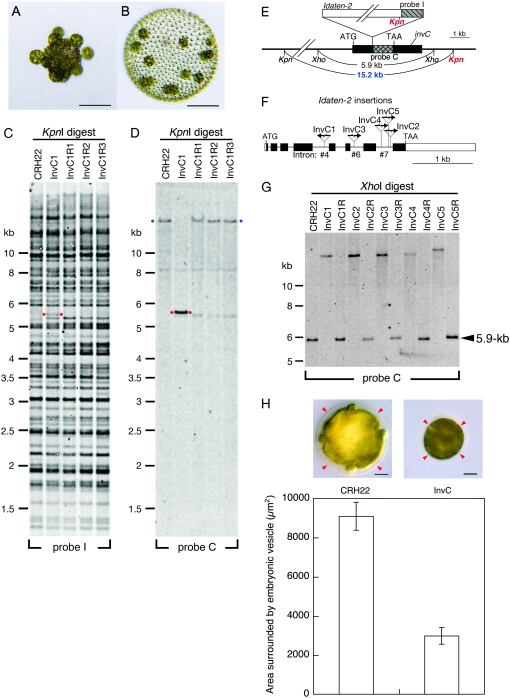
Transposon tagging with Idaten-2. (A) A young adult of the “fully inversionless” mutant, InvC1; note gonidia that are exposed on the outside. Bar, 100 μm. (B) A young adult of InvC1R, a revertant strain derived from InvC; note wild-type morphology. Bar, 100 μm. (C) A Southern blot of KpnI-digested DNAs from CRH22, InvC1, and three InvC1 revertants was hybridized to probe I, which was derived from Idaten as shown in E and Figure 2A. Red dots mark a 5.3-kb band that was detected in InvC1 but in none of the other strains. (D) A similar blot hybridized to probe C, which was derived from a piece of the genomic DNA adjacent to the Idaten insertion site, as shown in E. In addition to the original 5.3-kb fragment in InvC1 (red dots), probe C detected much larger fragments in CRH22 and all three revertants (blue dots). (Note that signals from the large bands are weak because transfer of such large DNA fragments from gel to membrane is generally incomplete.) (E) Restriction map of the invC region of the Idaten-2-tagged InvC1 mutant. The gray cross-hatched and hatched rectangles indicate the region of invC corresponding to probe C and the region of Idaten-2 corresponding to probe I, respectively. The black rectangles represent the rest of the invC locus and the white rectangle represents the rest of Idaten-2, which is shown at the top of its insertion site. The two red Kpn labels indicate the two KpnI sites that border the 5.3-kb fragment marked with red dots in C. The blue 15.2-kb label identifies the KpnI fragment that is seen in strains that lack Idaten-2 inserts in the invC locus (D). (F) Intron–exon map of invC. Rectangles indicate exons and connecting lines represent introns. Arrows show the Idaten-2 insertion sites in five InvC mutants. The direction of each arrow indicates the orientation of the Idaten-2 insert, relative to the orientation diagrammed in Figure 2A. (G) Southern blot analysis of XhoI-digested DNAs from five InvC strains. The 5.9-kb fragment that is detected by probe C in DNA samples from CRH22 and the five revertant strains is replaced by a much larger (>10-kb) fragment in the five InvC mutants, because of the Idaten-2 inserts in their invC genes. (H) Representative images of wild-type (CRH22; left) and InvC1 (right) embryos right before inversion show the size difference of the embryonic vesicle (arrowheads) that surrounds the embryo between two strains. It is noted that the InvC embryo appears to be tightly packed in the smaller vesicle, in which the space between the vesicle and the embryo is almost missing, while such space is obvious in wild type. In InvC, it is also hard to see individual gonidia and somatic cells compared to those of wild type. The bar chart indicates the morphometrical area surrounded by the vesicle with standard error bars (n = 30 for CRH22 and n = 16 for InvC1). Bar, 20 μm.

