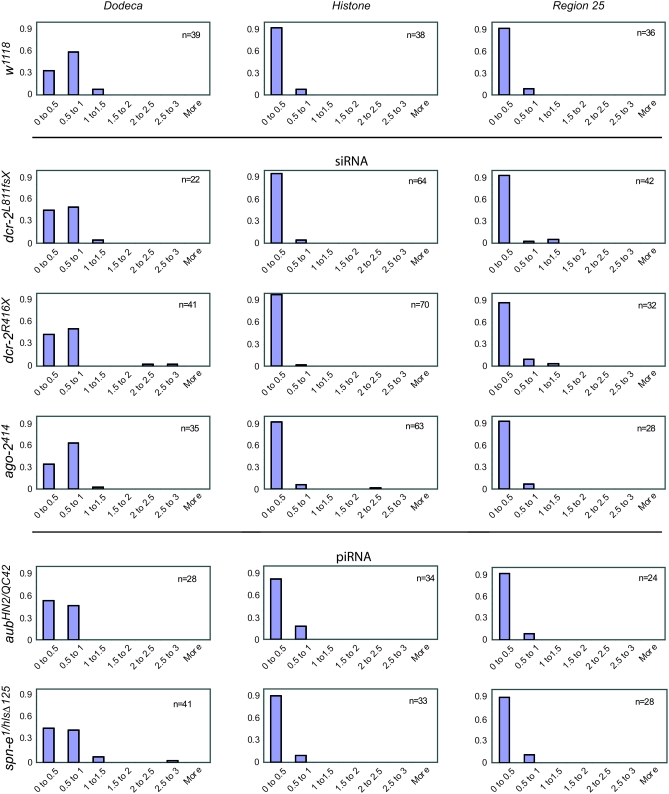
Figure 3.—
Distribution of distances between foci (in μm) of C(3)G staining nuclei of regions 2a and 2b of the germarium in w1118, siRNA defective and piRNA/rasiRNA defective females. Rows 2, 3, and 4 indicate females that were homozygous for defects in the siRNA machinery. Rows 5 and 6 indicate females that were trans-heterozygous for defects in the piRNA/rasiRNA machinery.

