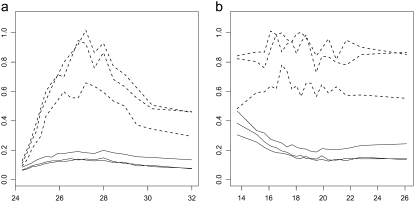
Figure 3.—
Relationship between the intraspecific (solid lines) and interspecific (dashed lines) standard deviation (y-axes) and the mean expression level (x-axes) before (a) and after (b) the interspecific variance-stabilizing transformation, in the QQ-HCR data set. The intraspecific variance is not stabilized and is accounted for explicitly on a probe-by-probe or a probe-set-by-probe-set basis in the model.

