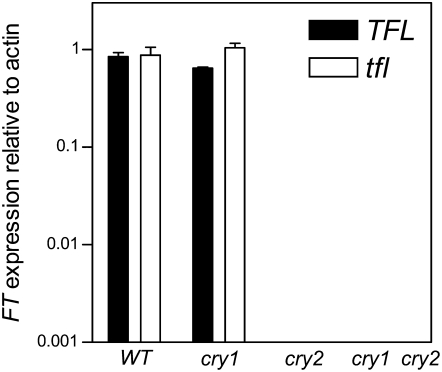
Figure 4.—
Reduced expression of FT in the cry2 and cry1 cry2 double-mutant background under SD. Seedlings were grown under SD for 15 days and harvested close to the end of the photoperiod. Data are means and SE of two biological replicates. Factorial ANOVA indicates significant effects of CRY2 vs. cry2 (P < 0.0001) and no effects of TFL1 vs. tfl1 or interaction. FT expression is not detectable in the cry2 and cry1 cry2 mutant background under the nonsaturating conditions used here but it was detectable under saturating conditions.

