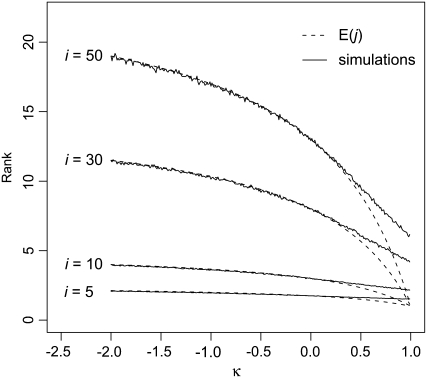
Figure 4.—
The expected fitness rank after a single step in adaptation. The dashed lines give the theoretical expectation according to Equation 22, and the solid lines give the averages of 10,000 simulated data sets. Simulations were performed using R (R Development Core Team 2006).

