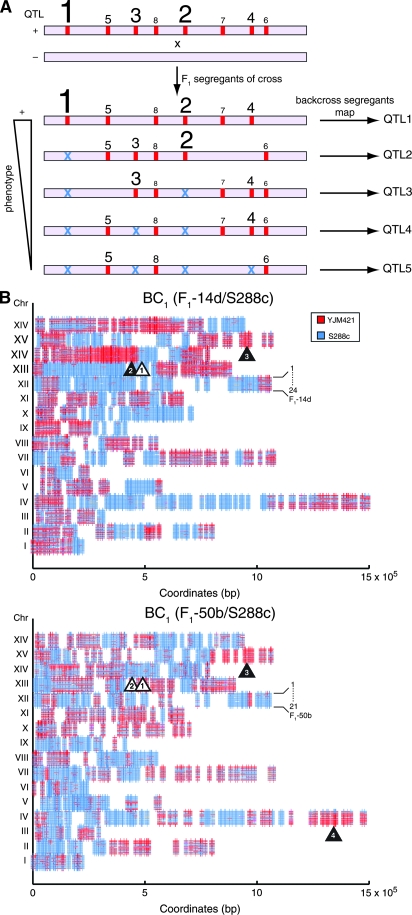
Figure 2.—
(A) Targeted backcross mapping strategy to sequentially uncover QTL. Consider a quantitative trait in a (+) strain, defined by multiple QTL alleles (red bars) with different contributions to a phenotype (the larger the type size, the larger the phenotypic effect). F1 segregants of a cross, between (+) and (−) parental stains, show a range of phenotypes. The best F1 (+) segregant is backcrossed to the (−) parent. Analysis of these backcross segregants would fine map and identify QTL-1. Similar analysis of the next best F1 (+) segregant that lacks QTL-1 (shown as blue ×) would then fine map QTL-2 in the next backcross segregants. Iterative fixation of major-effect QTL by a targeted selection of F1 segregants for further backcrossing would map minor-effect QTL. (B) Genomic linkage scans of backcross segregants using microarrays. Genotypes of 24 and 21 backcross segregants of F1-14d/S288c and F1-50b/S288c, respectively, were determined by DNA hybridization. Vertical lines along chromosomes are SFPs; segregants are stacked by chromosome; YJM421-derived regions are in red, S288c-derived regions in blue. Htg QTL are marked with triangles (fixated ones indicated in white and newly detected in black). In F1-14d/S288, Htg-QTL-1 (chromosome XIV) was fixed and Htg-QTL-2 (chromosome XIV) and Htg-QTL-3 (chromosome XV) were mapped. In F1-50b/S288c, Htg-QTL-1 and Htg-QTL-2 (chromosome XIV) were fixed and Htg-QTL-3 (chromosome XV) and Htg-QTL-4 (chromosome IV) were mapped.

