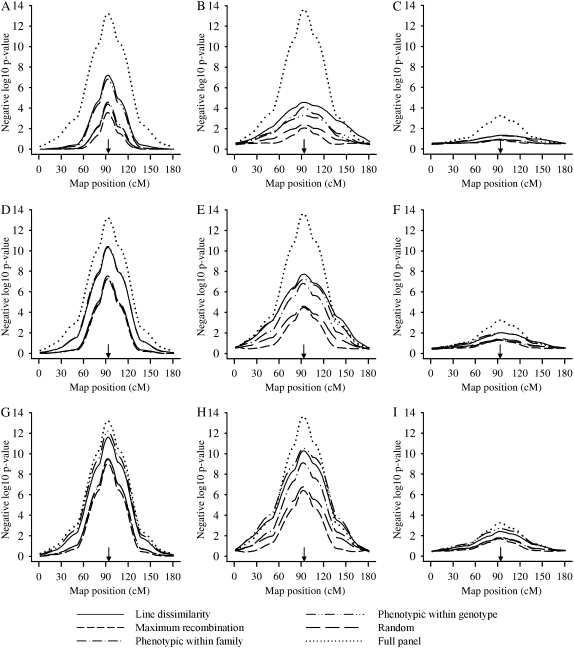
Figure 1.—
Negative logarithm base 10 of P-values of the likelihood-ratio test for scanned positions at linkage groups averaged over all the replicates for the different selective profiling strategies, analysis methods (A, D, and G, bivariate; B, E, and H, univariate; and C, F, and I, covariate analyses), and sample sizes (A–C, 80; D–F, 160; and G–I, 240) for the high-correlation scenario. Arrows point to the true QTL location.

