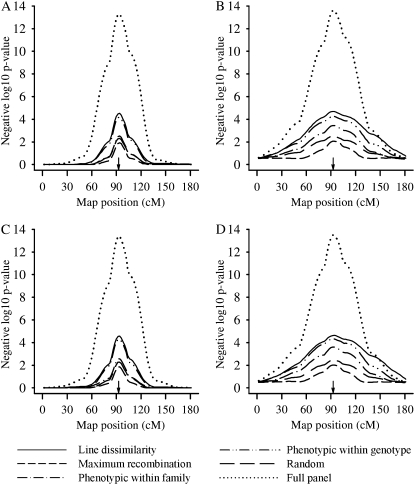
Figure 2.—
Negative logarithm base 10 of P-values of the likelihood-ratio test for scanned positions at linkage groups averaged over all the replicates for the different selective profiling strategies at a selected sample size of 80, for bivariate (A and C) and univariate analysis methods (B and D), for the low- (A and B) and medium- (C and D) correlation scenarios. Arrows point to the true QTL location.

