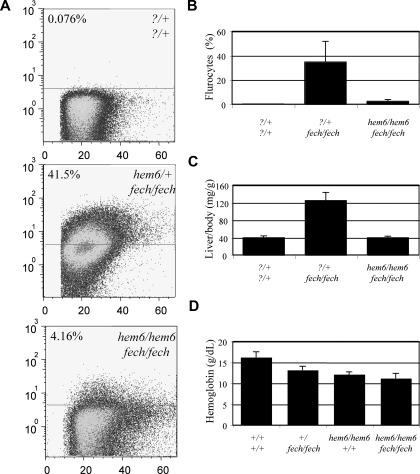
Figure 4.
hem6 modifies erythropoietic protoporphyria. (A) Flow cytometric analysis of erythroid PPIX levels in 129S6;C- fechm1Pas/+ × 129S6;B6-hem6 intercross offspring, showing a representative set of 3 animals with key genotypes. Numbers in the upper left corner of each scattergram represent the percentage of cells in the fluorocyte gate. The horizontal lines separate the positive gate (above the line) from the negative gate (below the line). (B) Histogram of the average fluorocyte percentage. (C) Liver–body weight ratios of selected genotypes. (D) Hemoglobin levels of selected genotypes. All error bars represent plus or minus 1 SD.

