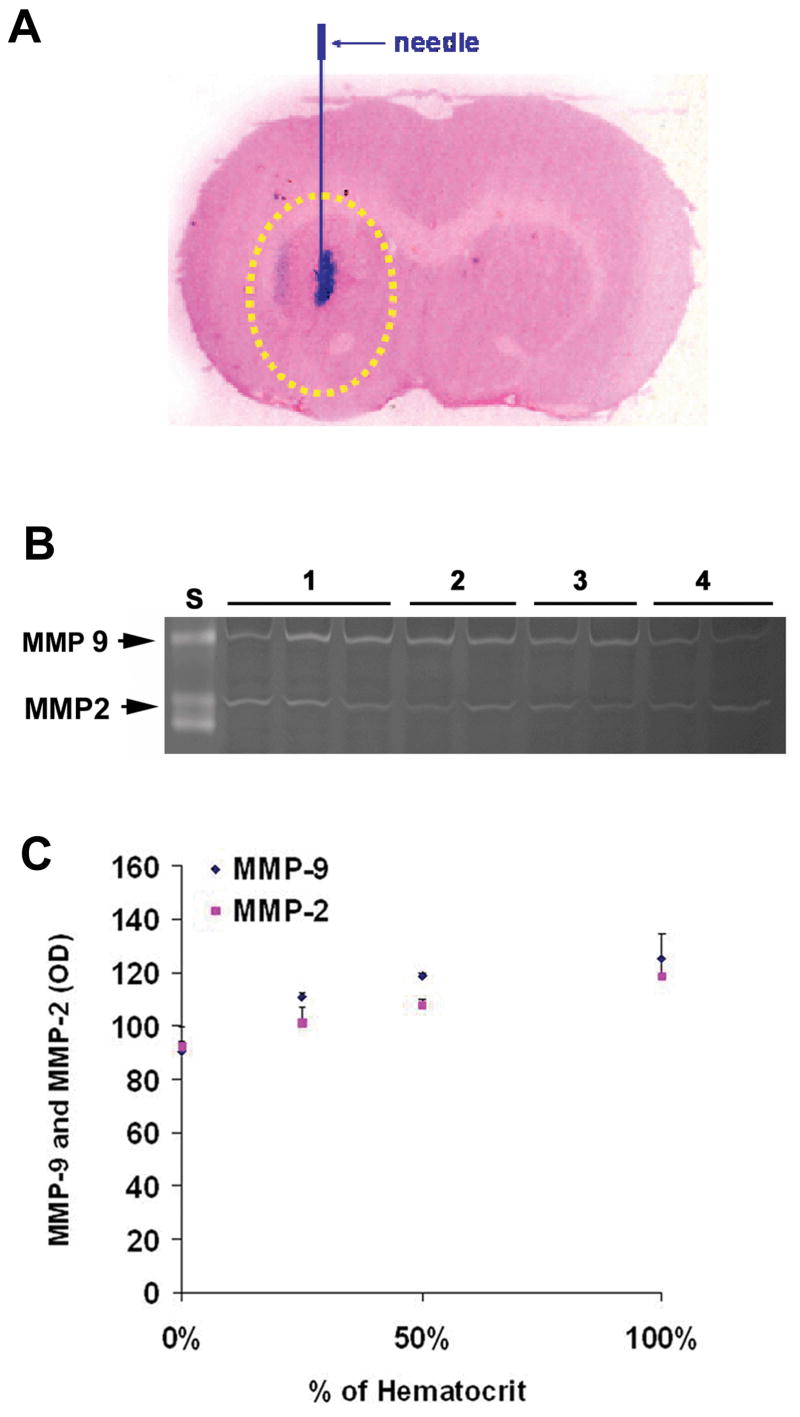
Figure 8.
A. coronal section of mouse brain showing the site of blood infusion and tissue sampling. Arrow indicates the position of blood (in red) infusion into striatum of the mouse brain. Yellow circled area represents the area of tissue sampling for assessing the level of MMPs. B. MMP-9 and MMP-2 level assessed by zymography in mice brain 3hr following whole blood injection. N= 3 for each treatment group. S: MMP standards, 1: 100% of original hematocrit, 2: 50% of original hematocrit, 3: 25% of original hematocrit, 4: normal saline. C. Quantitation (Optical density) of MMP-9 and MMP-2 levels.

