Figure 1.

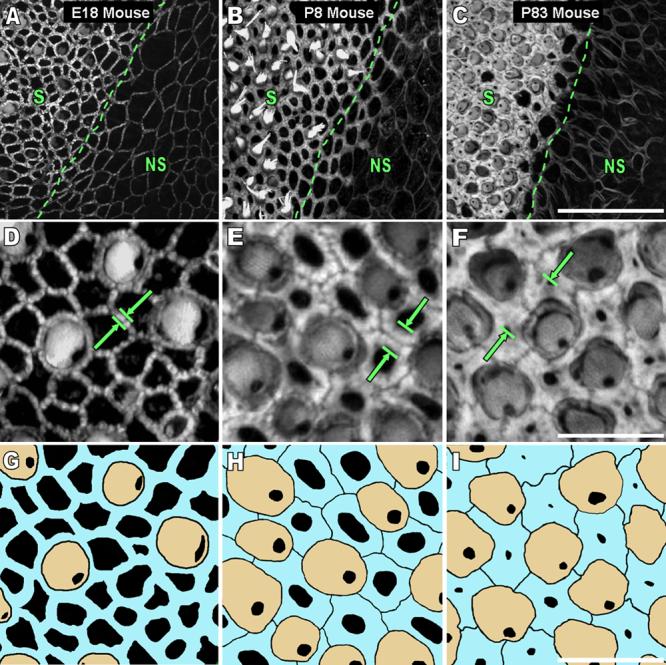
The width of circumferential F-actin bands in utricular supporting cells of the sensory epithelium and cells of the nonsensory epithelium increases in mice as they develop and mature. A-C) The images are high resolution (63x 1.4NA objective, 0.3 μm thick confocal sections) 2-D z-projections of a stack of images starting at least 5 μm above and ending at least 5 μm below where the bands were detectable from utricles of mice ages embryonic day 18 (E18), postnatal day 8 (P8), and P83. The transition from sensory epithelium (S) to nonsensory epithelium (NS) shows the difference in width of F-actin bands between these two regions as mice age. Circumferential F-actin bands extend further from the cell junctions towards the center of the cell in the S than in the NS as mice develop and mature. Scale bar for A-C in C, 30 μm. D-F) A high magnification image of the S in the frames in A shows that the width of F-actin bands (green arrows) in supporting cells of the S increases almost to the extent of covering the entire apical surface area of the supporting cells by P83. Scale bar for D-F in F, 10 μm. G-I) An overlay of the image in B shows the circumferential F-actin bands of supporting cells (blue) in relation to the actin-rich cuticular plates of hair cells (tan). A gap between the F-actin bands of adjacent supporting cells becomes resolvable as mice age, and as a result, the outlines of individual supporting cells are seen in the P8 and P83 mouse frames. Scale bar for G-I in I, 10 μm.
