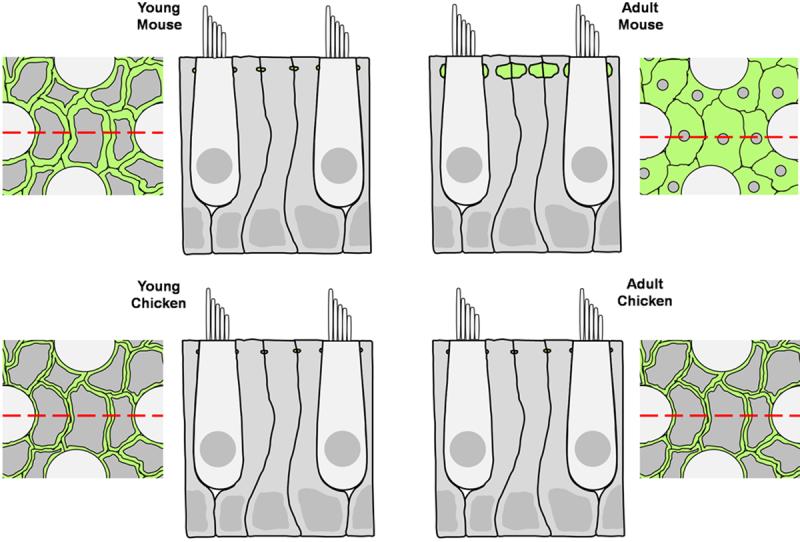
Figure 12.

A schematic of transverse and longitudinal sections through the utricular sensory epithelium compares the thickness of circumferential F-actin bands in chickens of all ages, immature mammals, and adult mammals. F-actin is colored green, supporting cells are colored gray, and hair cells are colored light gray. The red dashed lines on the transverse sections correspond to the location of the longitudinal sections.
