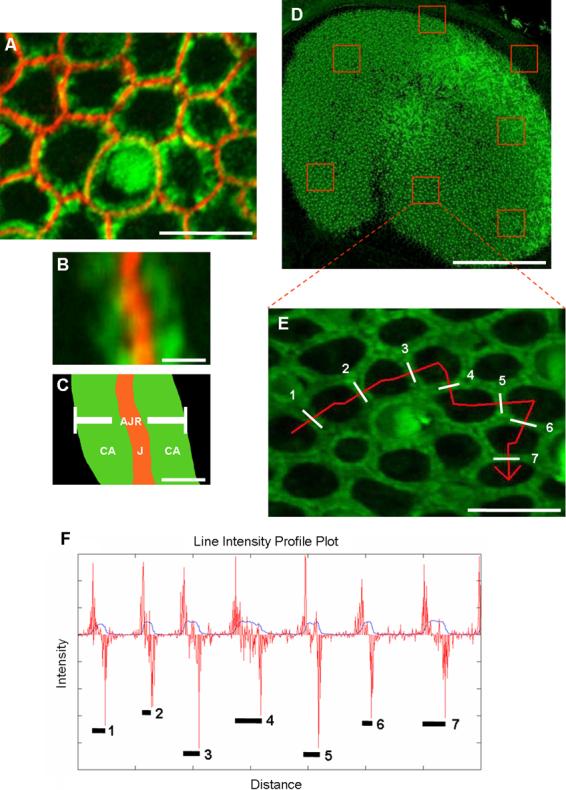
Figure 3.

The width of apical junction regions (AJRs) can be measured by plotting intensity profiles for lines drawn perpendicular to the junctions and analyzing them with a 1-D edge detector. A-C) An AJR was defined as the area containing the intercellular junction (J) of adjoined supporting cells and the circumferential F-actin (CA) extending from both sides of the junction into the intracellular domain of each cell. Circumferential F-actin is shown in green, and N-cadherin immunohistochemistry shows the junction in red. Scale bar in A, 5 μm; scale bar in B and C, 0.4 μm. D) Stacks of confocal images were collected of whole mount utricles stained with phalloidin. Scale bar, 150 μm. E) The stacks were converted to 2-D projections, and lines (red) were drawn perpendicular to the AJRs (designated by numbers and white bars). Scale bar, 10 μm. F) The 12-bit intensity values for each pixel in the lines were saved and plotted versus distance in Matlab R2007a (blue plot). The distance between the edges of local peaks on the intensity profile corresponded to the width of individual AJRs (numbers and black lines). The forward difference of the intensity profile, an approximation of the derivative, was calculated and plotted over the intensity profile (red plot). The intensity peak widths were then measured by calculating the distance between the local maxima and minima on the forward difference plot, which corresponded to the edges of each AJR. (A magenta-green version of this figure is provided in the supplementary material)
